Migrerad artikel
Denna artikel har migrerats från en tidigare version av vår webbplats och kan därför avvika i utseende och funktionalitet.
8 minuter
Many people are tempted to measure anything and everything as it might be important. The thing is, by focusing on everything you are not really focusing on anything at all.
The following steps will guide you through a way of thinking around your website, your goals and an overall plan of what to measure.
Which are your business goals > which are your digital goals > how do we measure these?
The first step is to disentangle the, sometimes, confusion about differences and similarities between the goals of the business and the digital goals. Your overall goal for your business might be to sell products and make money, but the purpose of your website might be to collect leads or strengthen your brand. Go forward clearing up what is what, provide the right information and push well though-out content in the right place.
What sort of website do you have? What is the purpose of the website? Depending on the type, there are differences in the way you should focus your collection of data. It might be that you are selling a tangible product, giving support about a topic or writing a blog, gathering interest in a service or product or just creating awareness around your brand. Knowing the purpose of your website is key when establishing what you should be measuring.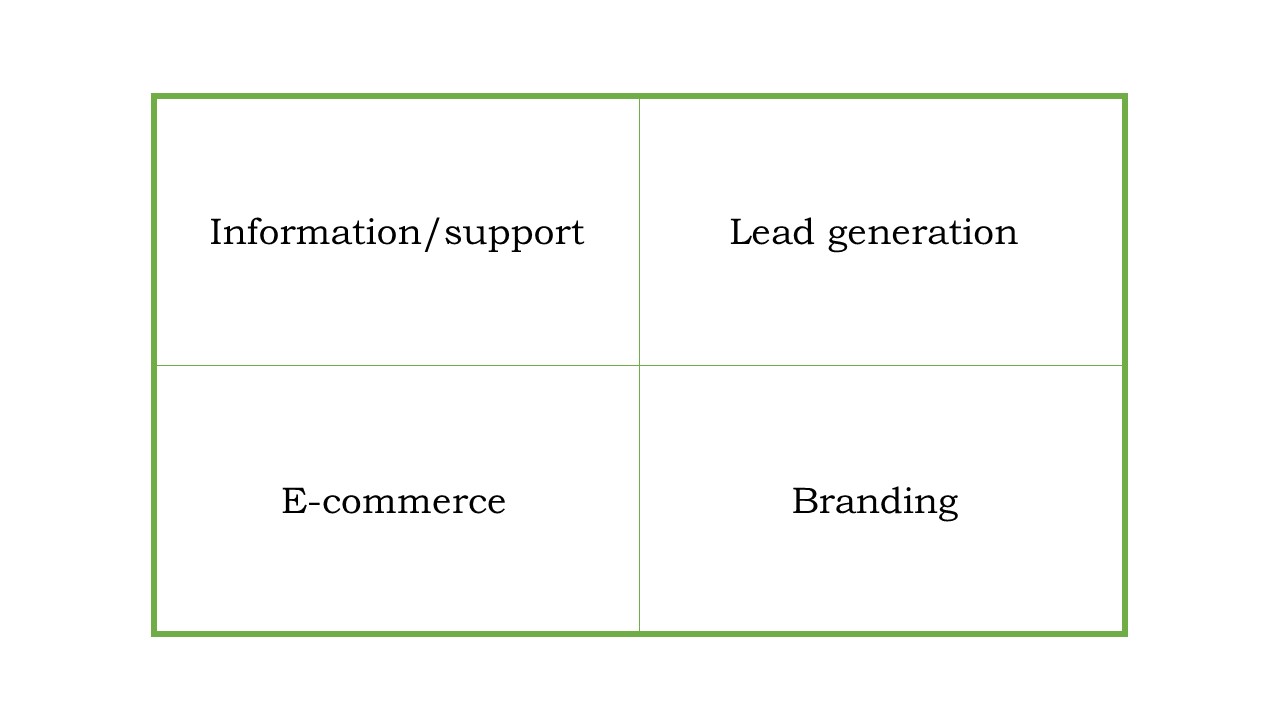
Following are a few examples of what you could be setting as KPI’s, to match what you are trying to achieve:
Which of these KPI’s are macro goals and which are micro goals? Your macro goals are your overall most important conversions and your micro goals measure things like engagement, leads, shares, retention and referrals. If your website is for example mainly focused in sharing information, your macro goal could be the number of subscribers you have and micro goals internal search keywords and comments added.
Who are you targeting? Are your visitors part of the group you are trying to target? Figure out who your customer is and get to know their needs and behaviour. It could be that you have an idea of who your customer is, but reality tells a different story. Make sure your idea and the reality correspond, so that you provide the right content and deliver what the user is expecting.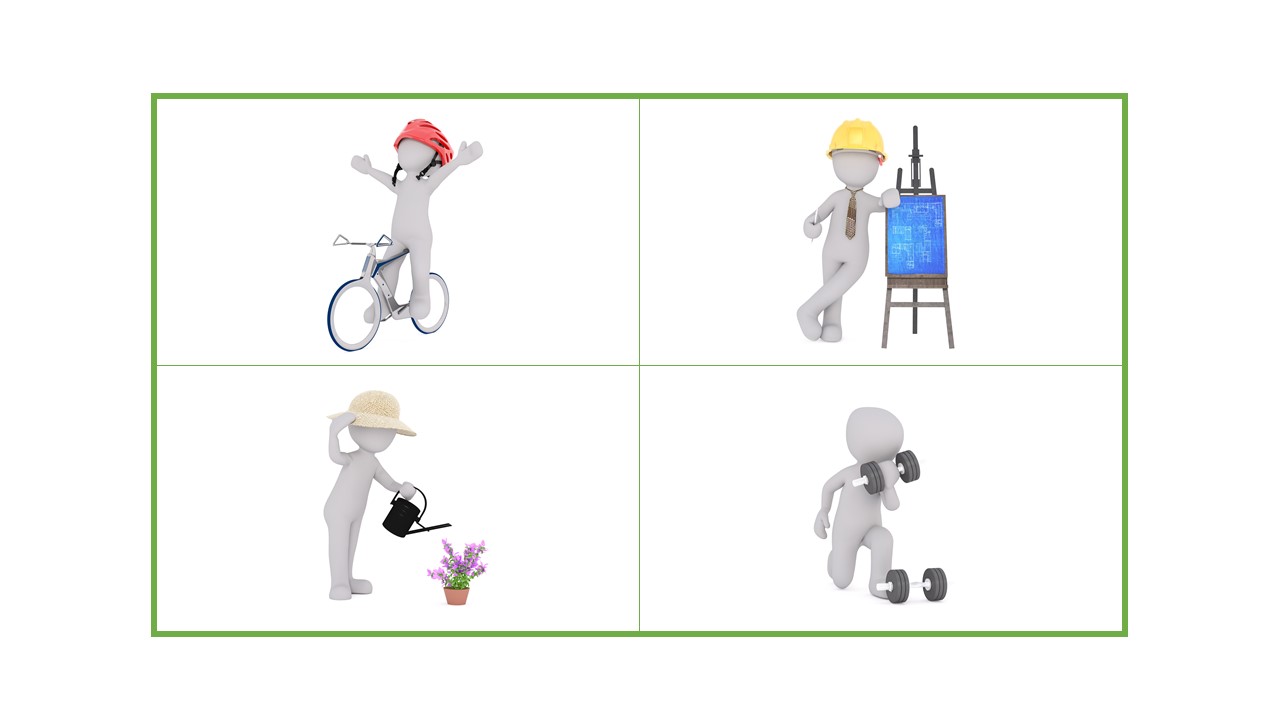
How long is a traffic cycle and a business cycle for your customers? Look in the data, how often do customers visit the site, is it more in the beginning of the week and declining towards the end of the week? Or is it busier in the beginning of the month and declining at the end of the month? This is the traffic cycle.
How long does it take for your customer to make their mind up about converting? Are they starting to visit you to gather information and then returning in a week’s time to complete a conversion? That is your business cycle.
This information can help you when you have come further in your analysis and you are ready to set up A/B tests for example. Knowing your cycles will play a key role when deciding on the length of your various tests, as you do not want to stop in the middle of a cycle. 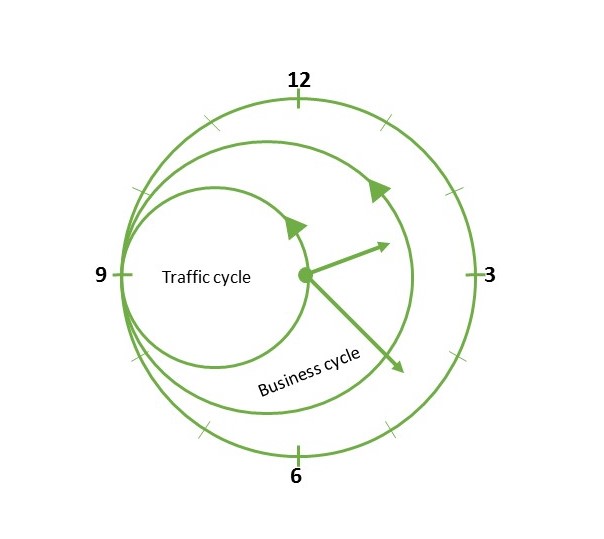
Now that you know what you are trying to achieve, set up a plan for how you are going to do it and how often you should measure and compare your KPI’s.
Always compare your KPI’s with previous period, otherwise they are just numbers taken out of context. It is the actual change that is important and that will let you know if you are doing better or worse. Once you know what you want to measure, start creating goals to get an overview of your effectiveness. Learn more about goals by reading Be Smart with goals in Google Analytics.
